Write a Figure Handler
A FigureHandler manages a figure displayed by a protocol. It creates the figure controls (typically a plot) and updates the figure as each epoch completes. A FigureHandler is generally used to graphically present data and perform online analysis.
This tutorial shows how to write a FigureHandler.
Step 1: Create a class
A FigureHandler is simply a MATLAB class that subclasses from symphonyui.core.FigureHandler.
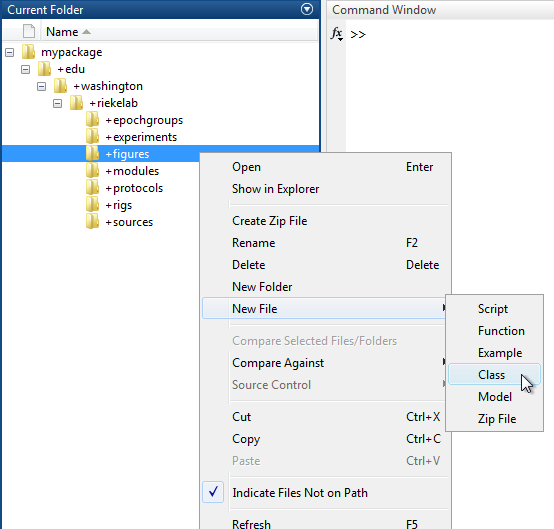
Create a new class in your personal Symphony package by navigating to the package in MATLAB's Current Folder, right-clicking on the "+figures" directory, and selecting New File > Class.
Name the class file "Demo.m" and open it in the MATLAB Editor.
classdef Demo
    %DEMO Summary of this class goes here
    %   Detailed explanation goes here

    properties
    end

    methods
    end

end
Remove the comments and edit the classdef line to subclass from the symphonyui.core.FigureHandler class.
classdef Demo < symphonyui.core.FigureHandler

    properties
    end

    methods
    end

end
You now have an empty FigureHandler.
Step 2: Create a constructor
You add plots and user interface controls to a figure handler in the constructor method. You can also accept parameters passed in by a protocol in the constructor.
Add a constructor method to the "Demo" figure handler with a "device" parameter.
classdef Demo < symphonyui.core.FigureHandler

    properties
    end

    methods

        function obj = Demo(device)

        end

    end

end
Add axes to the handler's figure by accessing its figure through the figureHandle property.
function obj = Demo(device)
    axes('Parent', obj.figureHandle);
end
Store the device and axes handle as a property of the handler for later use.
classdef Demo < symphonyui.core.FigureHandler

    properties
        device
        axesHandle
    end

    methods

        function obj = Demo(device)
            obj.device = device;
            obj.axesHandle = axes('Parent', obj.figureHandle);
        end

    end

end
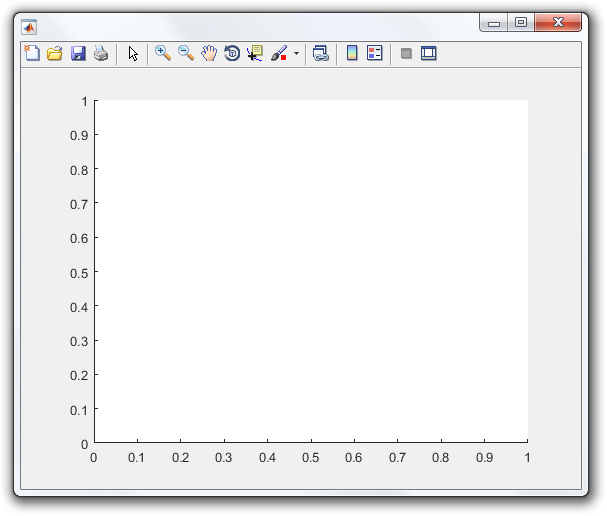
You now have a FigureHandler with an empty plot.
Step 3: Override handleEpoch
When a protocol completes an epoch, it passes the completed epoch to the handleEpoch() method of all open figure handlers. A figure handler then decides how to update its figure.
Override the handleEpoch() method in the "Demo" handler so you can define what it does when an epoch completes.
classdef Demo < symphonyui.core.FigureHandler

    properties
        device
        axesHandle
    end

    methods

        function obj = Demo(device)
            obj.device = device;
            obj.axesHandle = axes('Parent', obj.figureHandle);
        end

        function handleEpoch(obj, epoch)

        end

    end

end
Get the quantities and units of the response from the specified device for each completed epoch by using the getResponse() method on the epoch and the getData() method on the response.
function handleEpoch(obj, epoch)
    response = epoch.getResponse(obj.device);
    [quantities, units] = response.getData();
end
Get the sample rate of the response in hertz by using the quantityInBaseUnits of the response sampleRate property.
function handleEpoch(obj, epoch)
    response = epoch.getResponse(obj.device);
    [quantities, units] = response.getData();

    sampleRate = response.sampleRate.quantityInBaseUnits;
end
Plot the response over time on the handler axes.
function handleEpoch(obj, epoch)
    response = epoch.getResponse(obj.device);
    [quantities, units] = response.getData();

    sampleRate = response.sampleRate.quantityInBaseUnits;

    x = (1:numel(quantities)) / sampleRate;
    y = quantities;
    plot(obj.axesHandle, x, y);
end
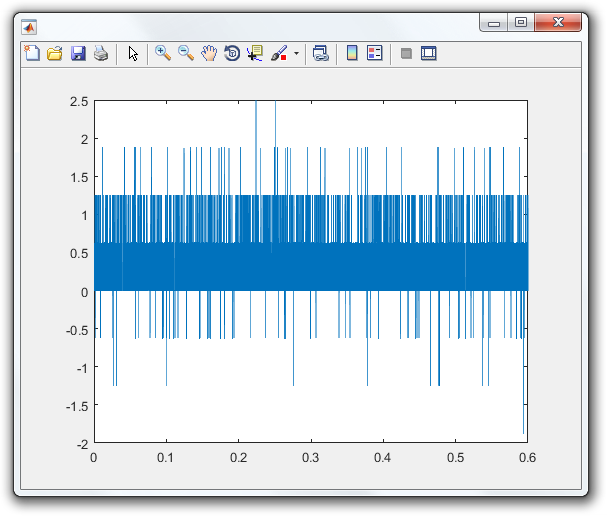
You now have a FigureHandler that plots the response of a specified device when each epoch completes.
classdef Demo < symphonyui.core.FigureHandler

    properties
        device
        axesHandle
    end

    methods

        function obj = Demo(device)
            obj.device = device;
            obj.axesHandle = axes('Parent', obj.figureHandle);
        end

        function handleEpoch(obj, epoch)
            response = epoch.getResponse(obj.device);
            [quantities, units] = response.getData();

            sampleRate = response.sampleRate.quantityInBaseUnits;

            x = (1:numel(quantities)) / sampleRate;
            y = quantities;
            plot(obj.axesHandle, x, y);
        end

    end

end
obj.showFigure('edu.washington.riekelab.figures.Demo', obj.rig.getDevice(obj.amp));